Stop Reporting Demo Counts
Start Proving Revenue Impact
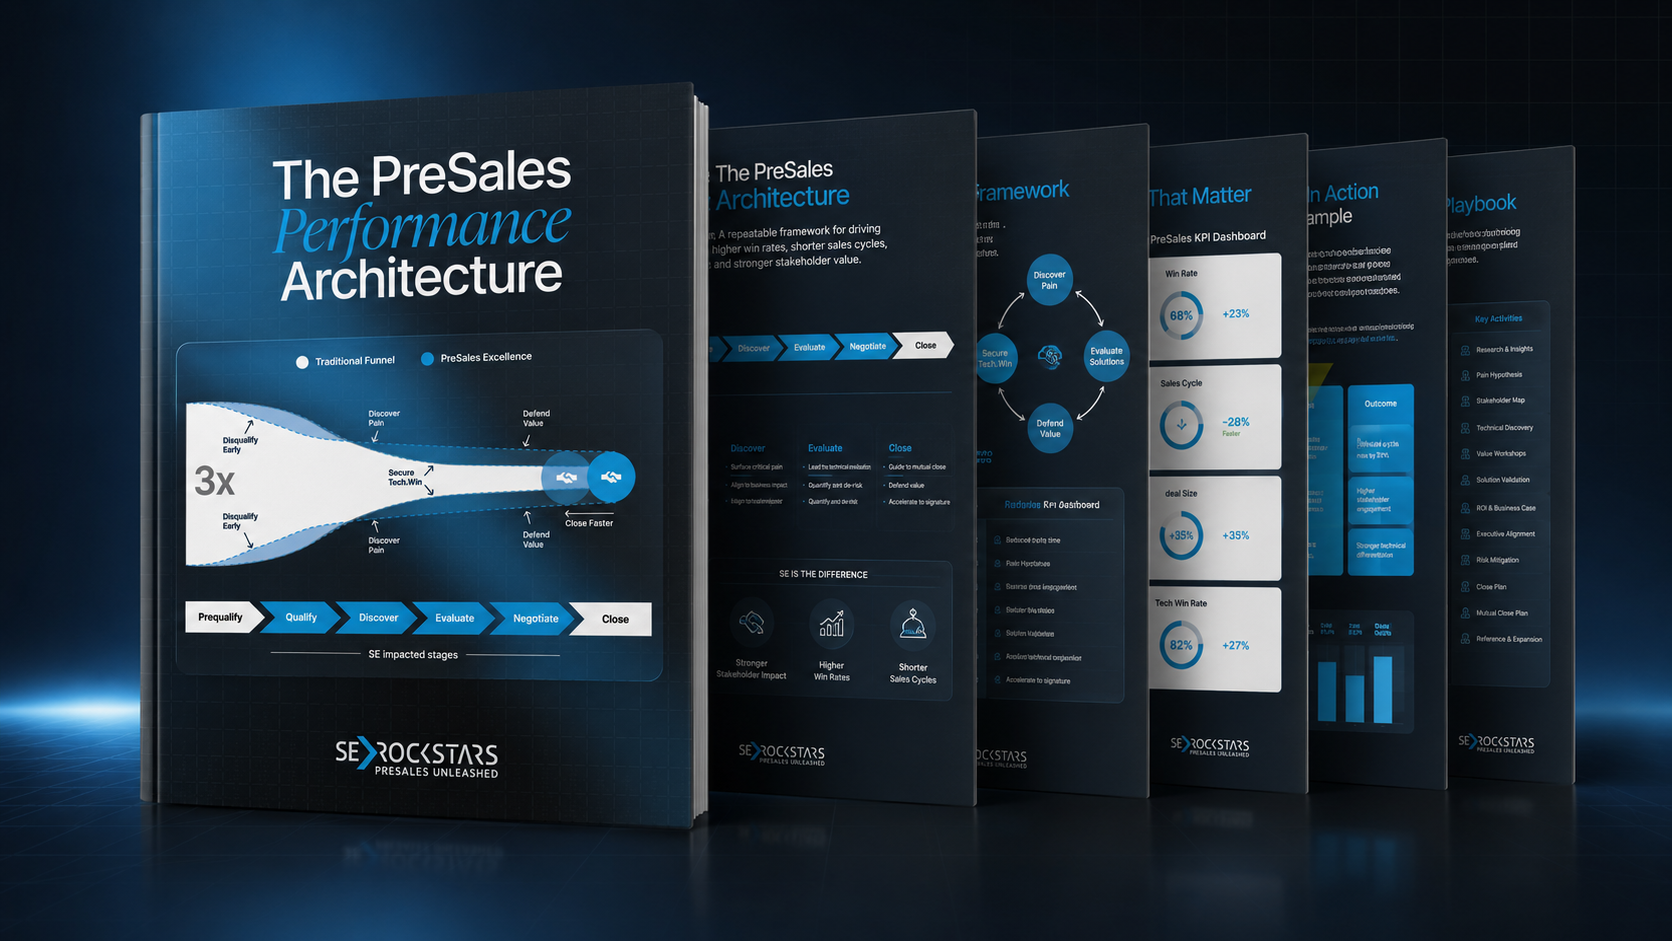
The SE KPI Playbook — the 10 metrics top Solution Engineering leaders use to show what their team actually drives: win rates, attached revenue, deal velocity.
Most SE teams get measured by activity: demos given, calls joined, hours logged. None of that survives a budget discussion.
This playbook gives you the PreSales Performance Architecture we use with 350+ Solution Engineers at companies like HubSpot, Salesforce, and Zscaler. Inside:

The 10 core KPIs — from SE-Attached Win Rate to Technical Win Rate to Sales Satisfaction — and what each one tells you
Leading vs. lagging: which numbers predict deals and which just report them
Metric pairing: how to combine indicators so your team can't game them
When the numbers are a compass, not a verdict — and what actually changes behavior
You'll get the playbook by email, plus a short personal walkthrough on how to apply it to your team. That part isn't automated — it's Tim or Jan.